back
UI/UX DESIGN, WEB DESIGN & DEVELOPMENT, DATABASE MANAGEMENT, GIS
Walk With Web
Role: Senior Web Designer
liberatedafricans.orgProject Toolkit
- HTML
- CSS
- PHP
- Bootstrap
- JavaScript/jQuery
- MySQL
- Figma
- Leaflet.JS
- GEOJSON
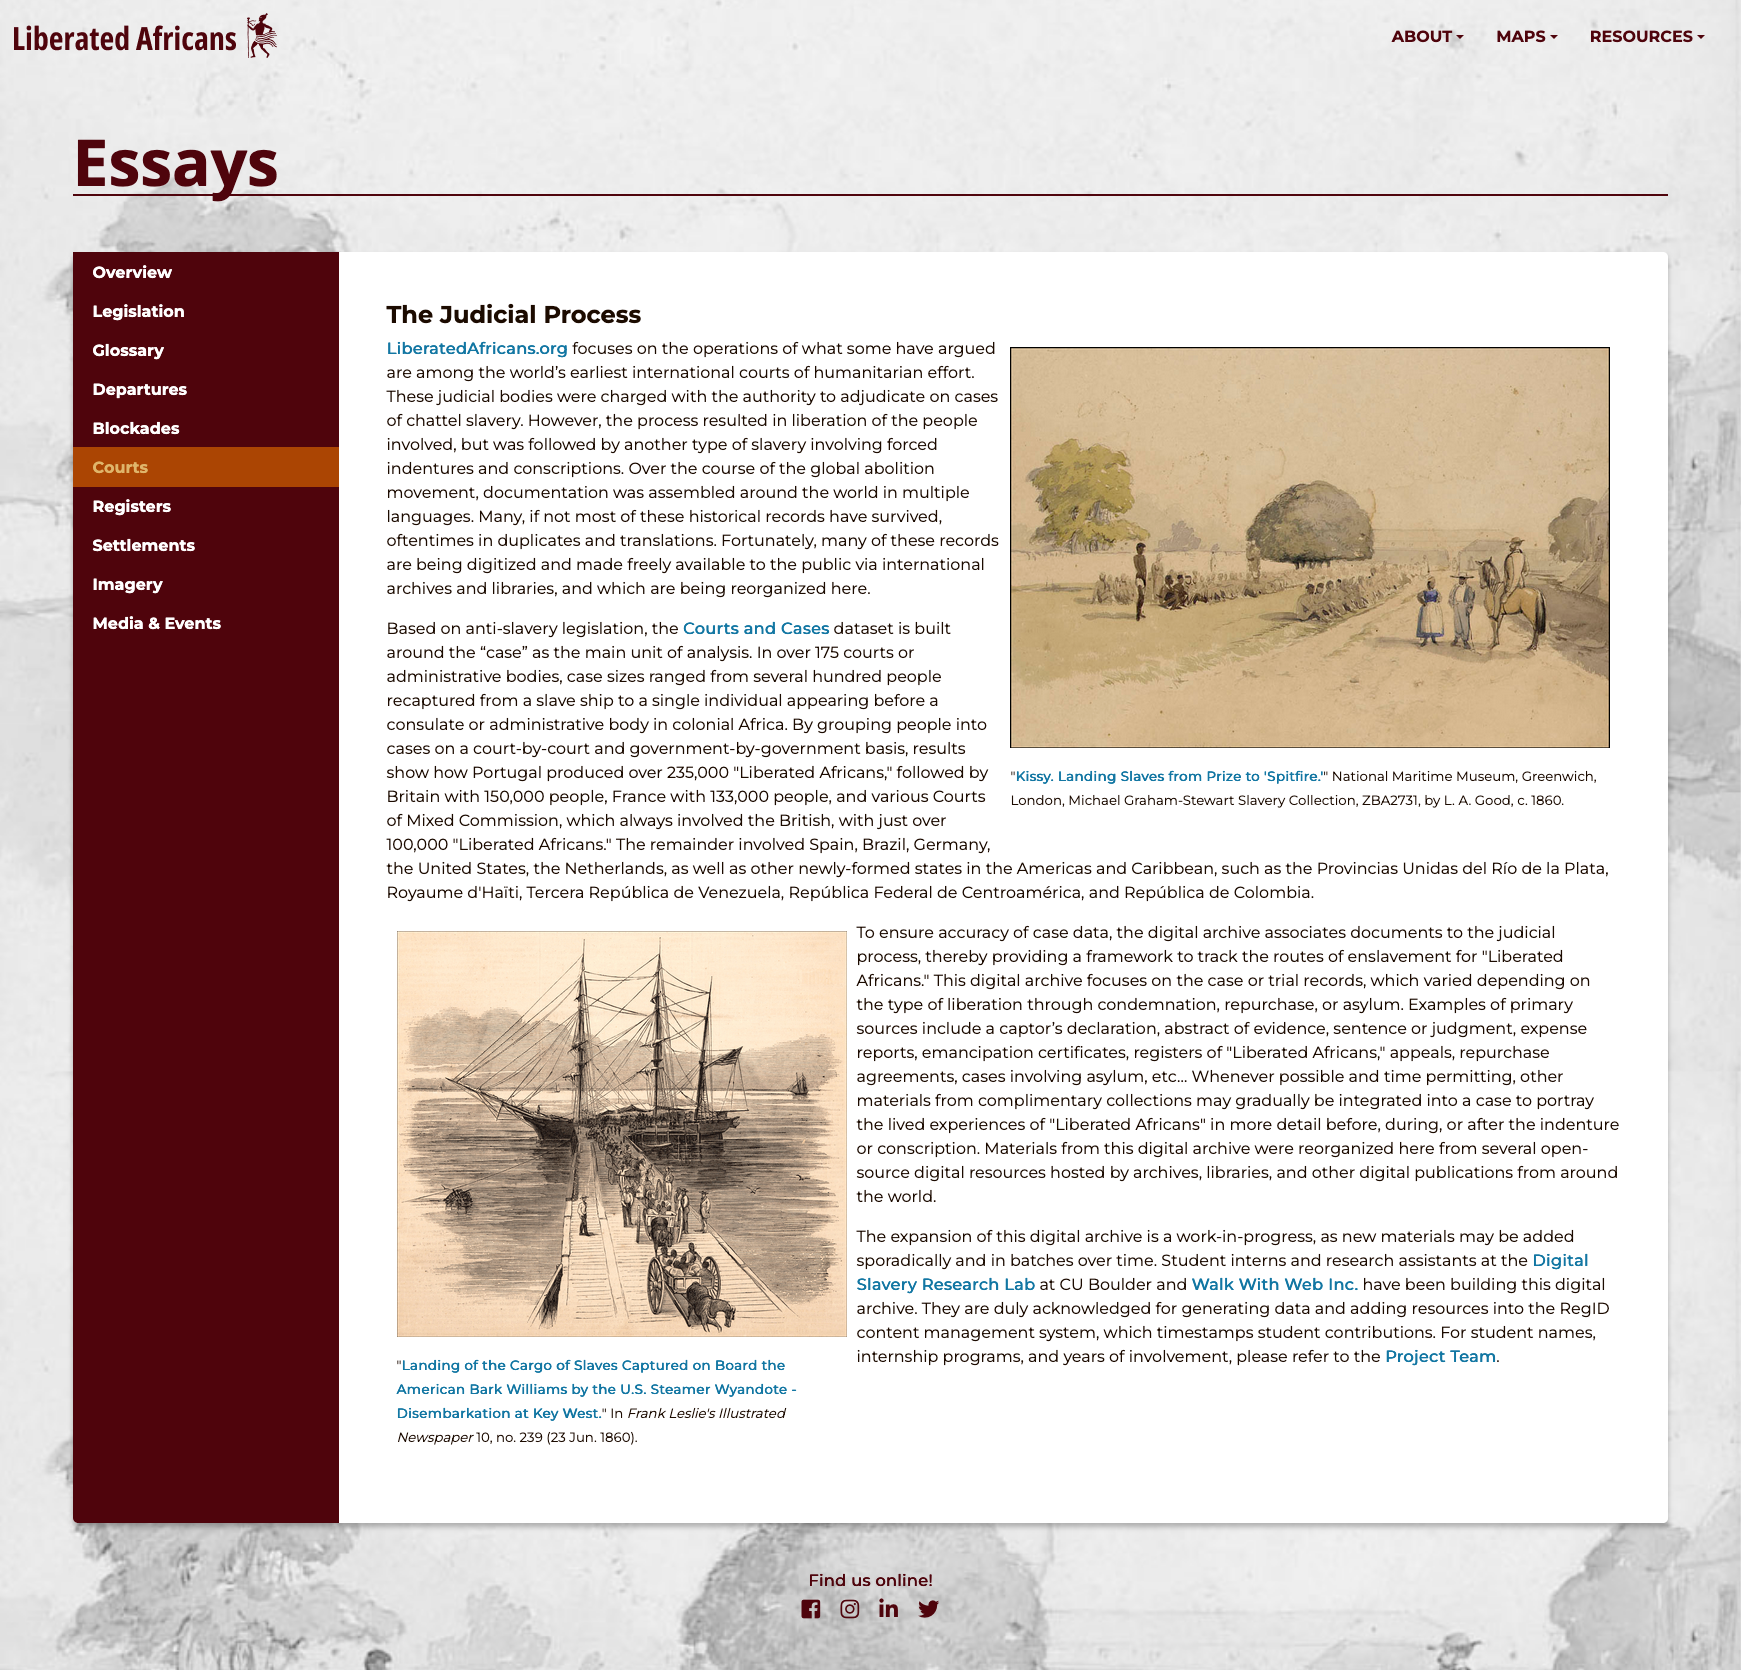
Liberated Africans project documents the lives of over 250,000 Africans emancipated under global campaigns to abolish slavery, as well as thousands of courts officials, ship captains, crews, and guardians of a special class of individuals known as Liberated Africans.
In my role as Senior Web Designer, I:
- Met with the project director to collect project requirements and feedback
- Designed the version 3 of the project website as an interactive high-fidelity Figma prototype
- Worked together with our Junior Developer, Saloni Pande, to set up the project's backend
- Oversaw the work of our teams web design interns
- Developed a responsive website using Bootstrap, HTML5, JavaScript, CSS, and PHP
- Imported and organized project data into MySQL tables from an Excel sheet of over 5,500 court records
- Maintained a MYSQL database used to manage the content on the website
- Created 4 interactive maps connected to the MySQL database
- Added unique project features to Regenerated Identities, a digital content management service provided by Walk With Web
The design for the third version of the site was created as a figma prototype.
To create the Liberated Africans interactive map, I used Leaflet.JS and circular markers to show the number of enslaved people by place. Each marker is clickable and when a marker is clicked, the data is shown in a filtered table.

To create the Blockades interactive map, I used Leaflet.JS and circular markers to show the blockades by country. The size of the marker varies based on the number of liberated africans found on the ships during the blockades. Each marker is clickable and when a marker is clicked, the data is shown in a filtered table.

To create the Departures interactive map, I used Leaflet.JS and GEOJSON objects to create clickable African regions. The colouring of the objects is designed like a heatmap, showing the number of liberated africans by region. Each object is clickable and when a marker is clicked, the data is shown in a filtered table.

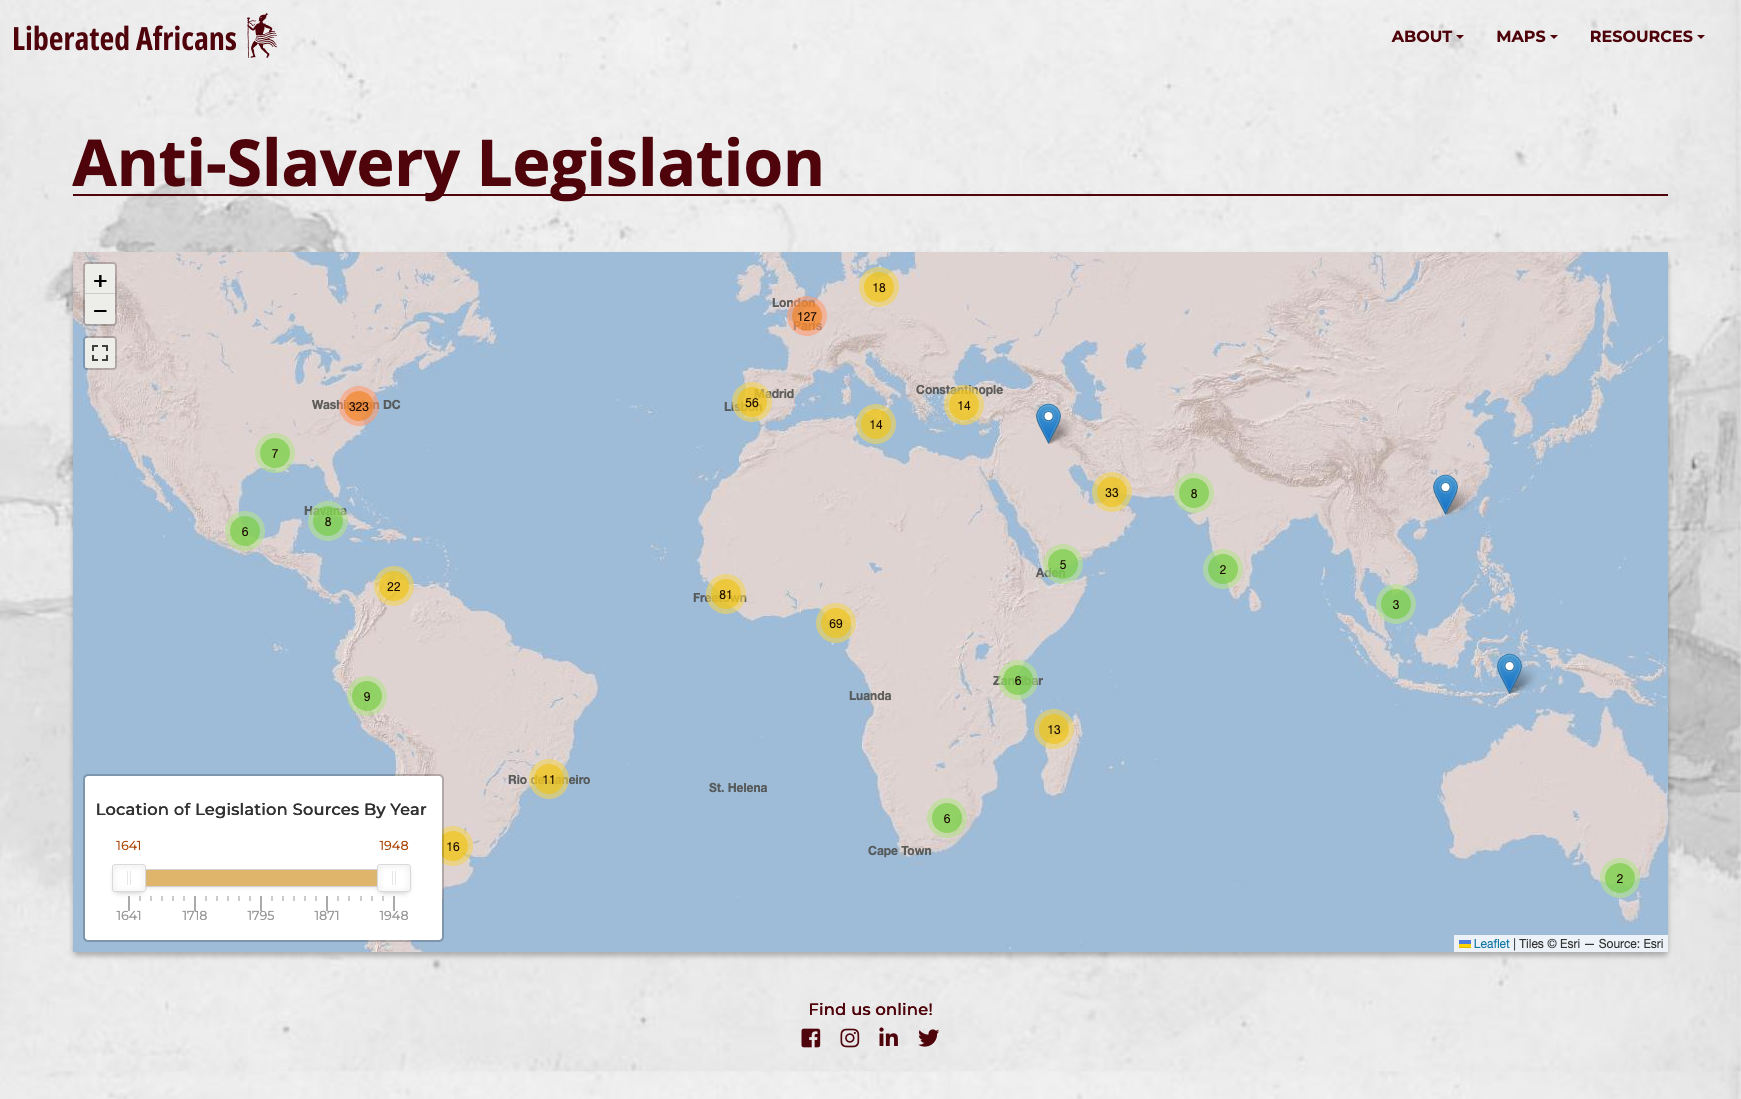
To create the Anti-Slavery Legislation interactive map, I used Leaflet.JS and PHP to query the database and plot areas where court proceedings were held. Each marker is clickable and when a marker is clicked, the data is shown in a tabular format in a new page.
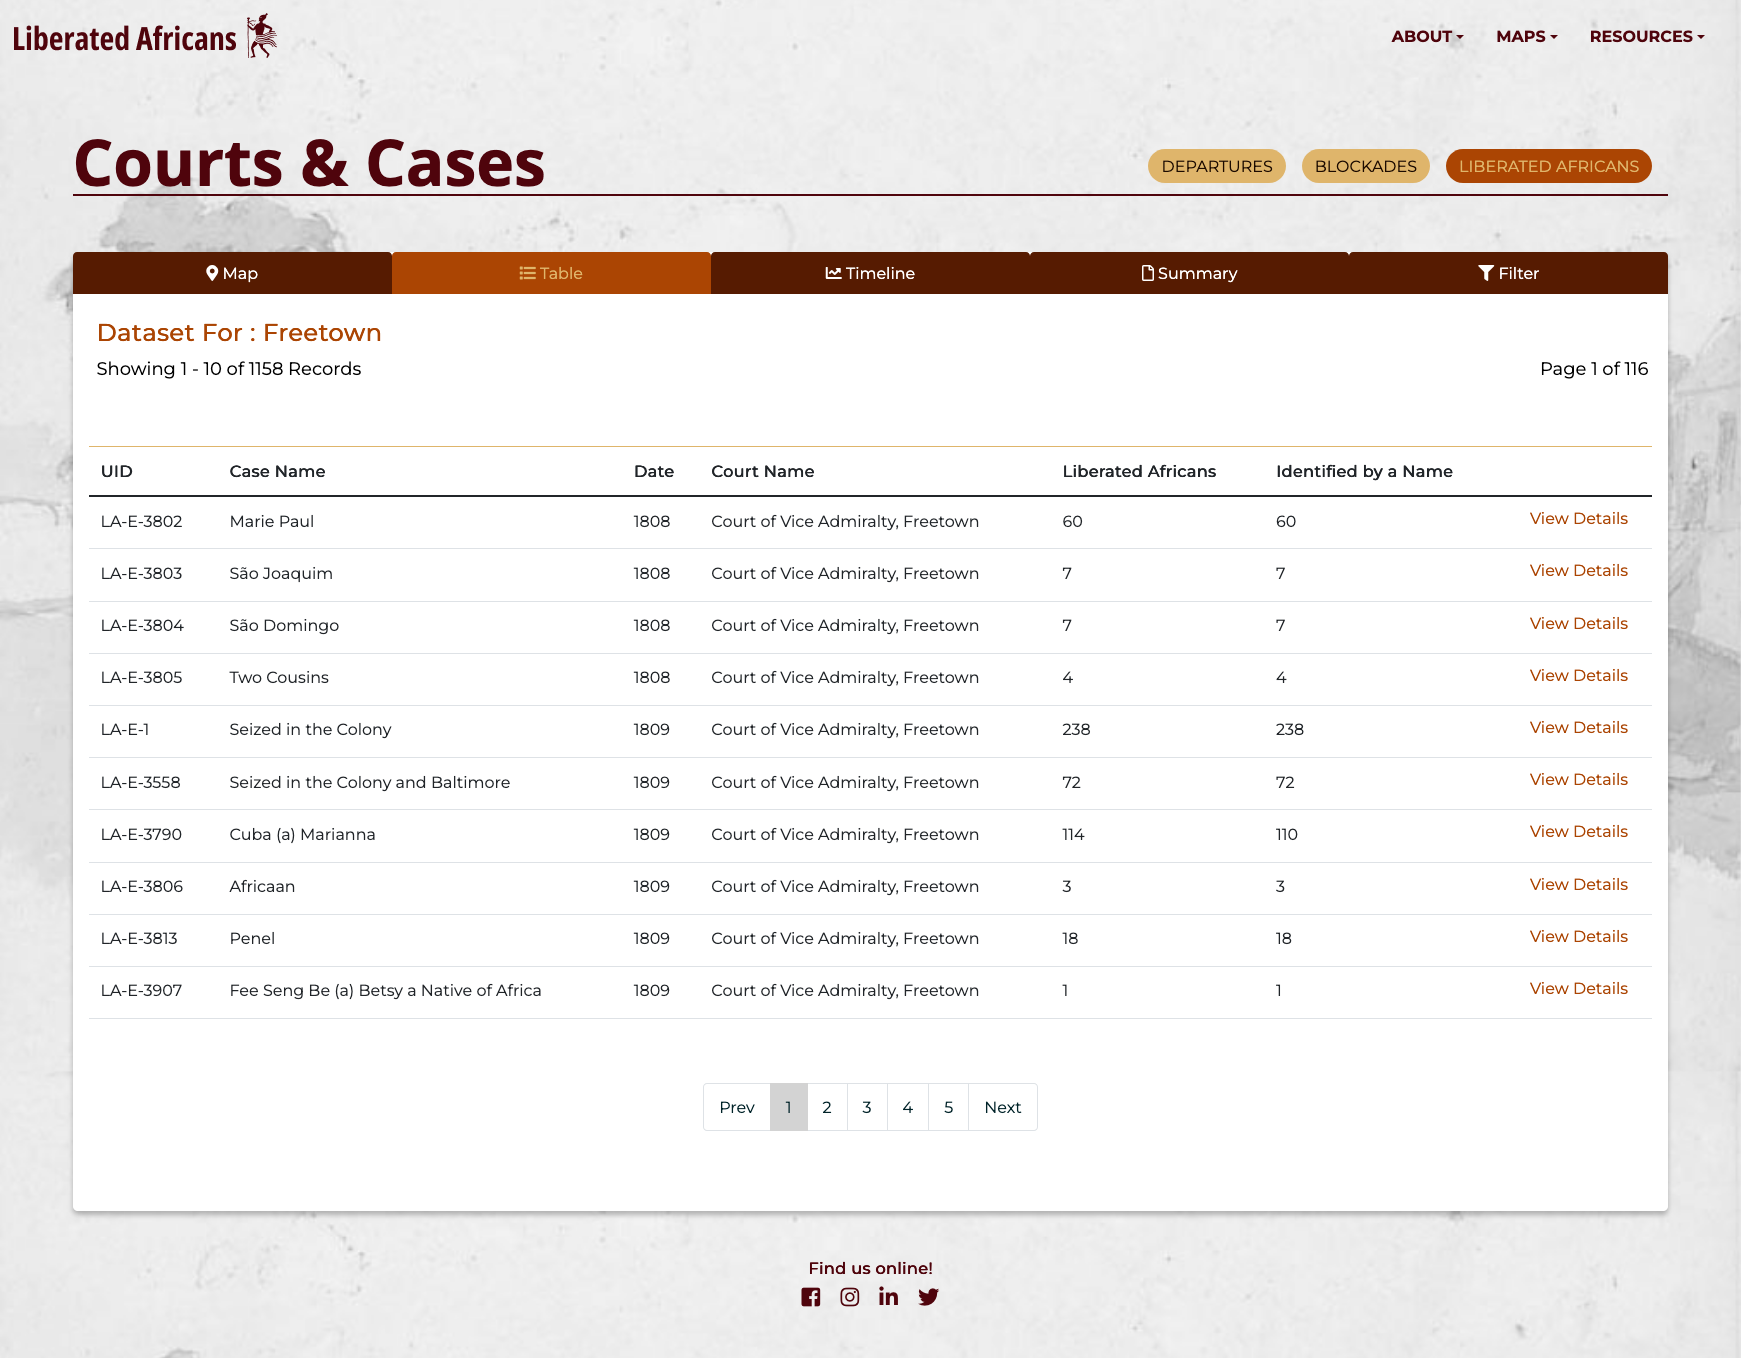
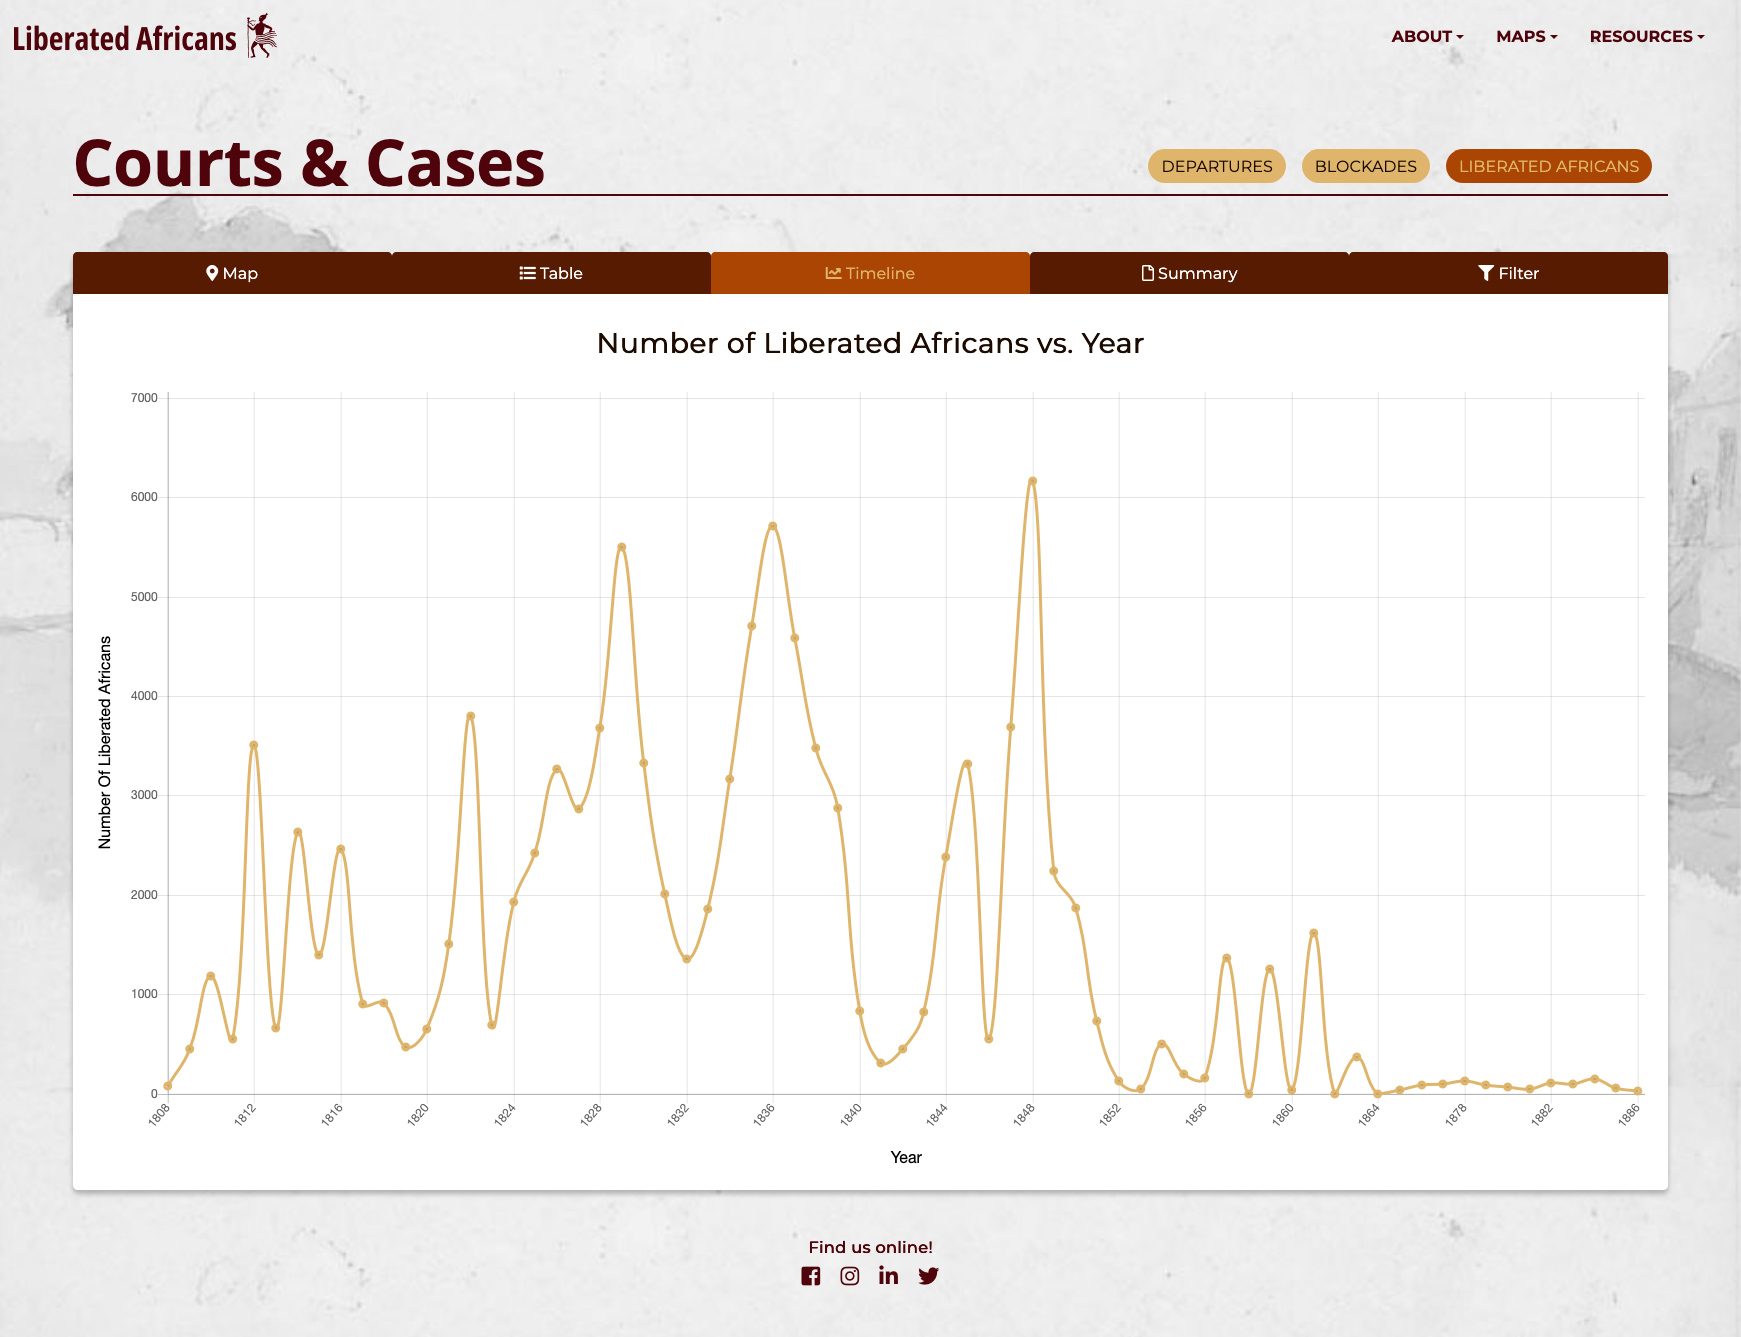
Results from filtering or clicking on the interactive maps can also be viewed in a tabular format or as a line graph.
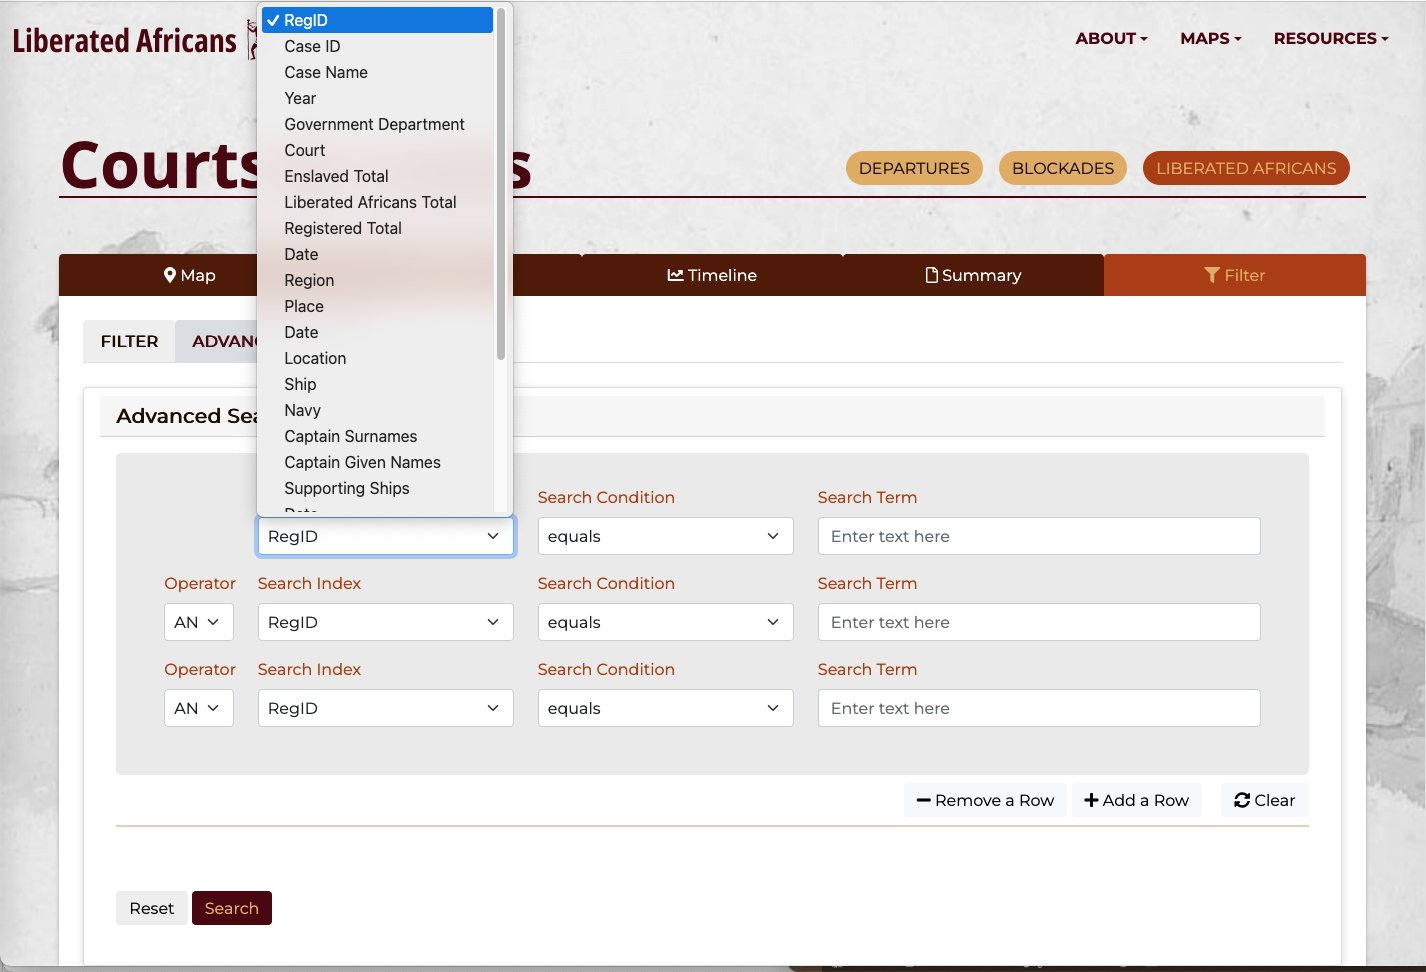
I designed a filter and advanced search that allows users to filter the tables and maps using either dates, courts, or geographical locations. The filter works using Ajax JavaScript and PHP queries to the MySQL database.
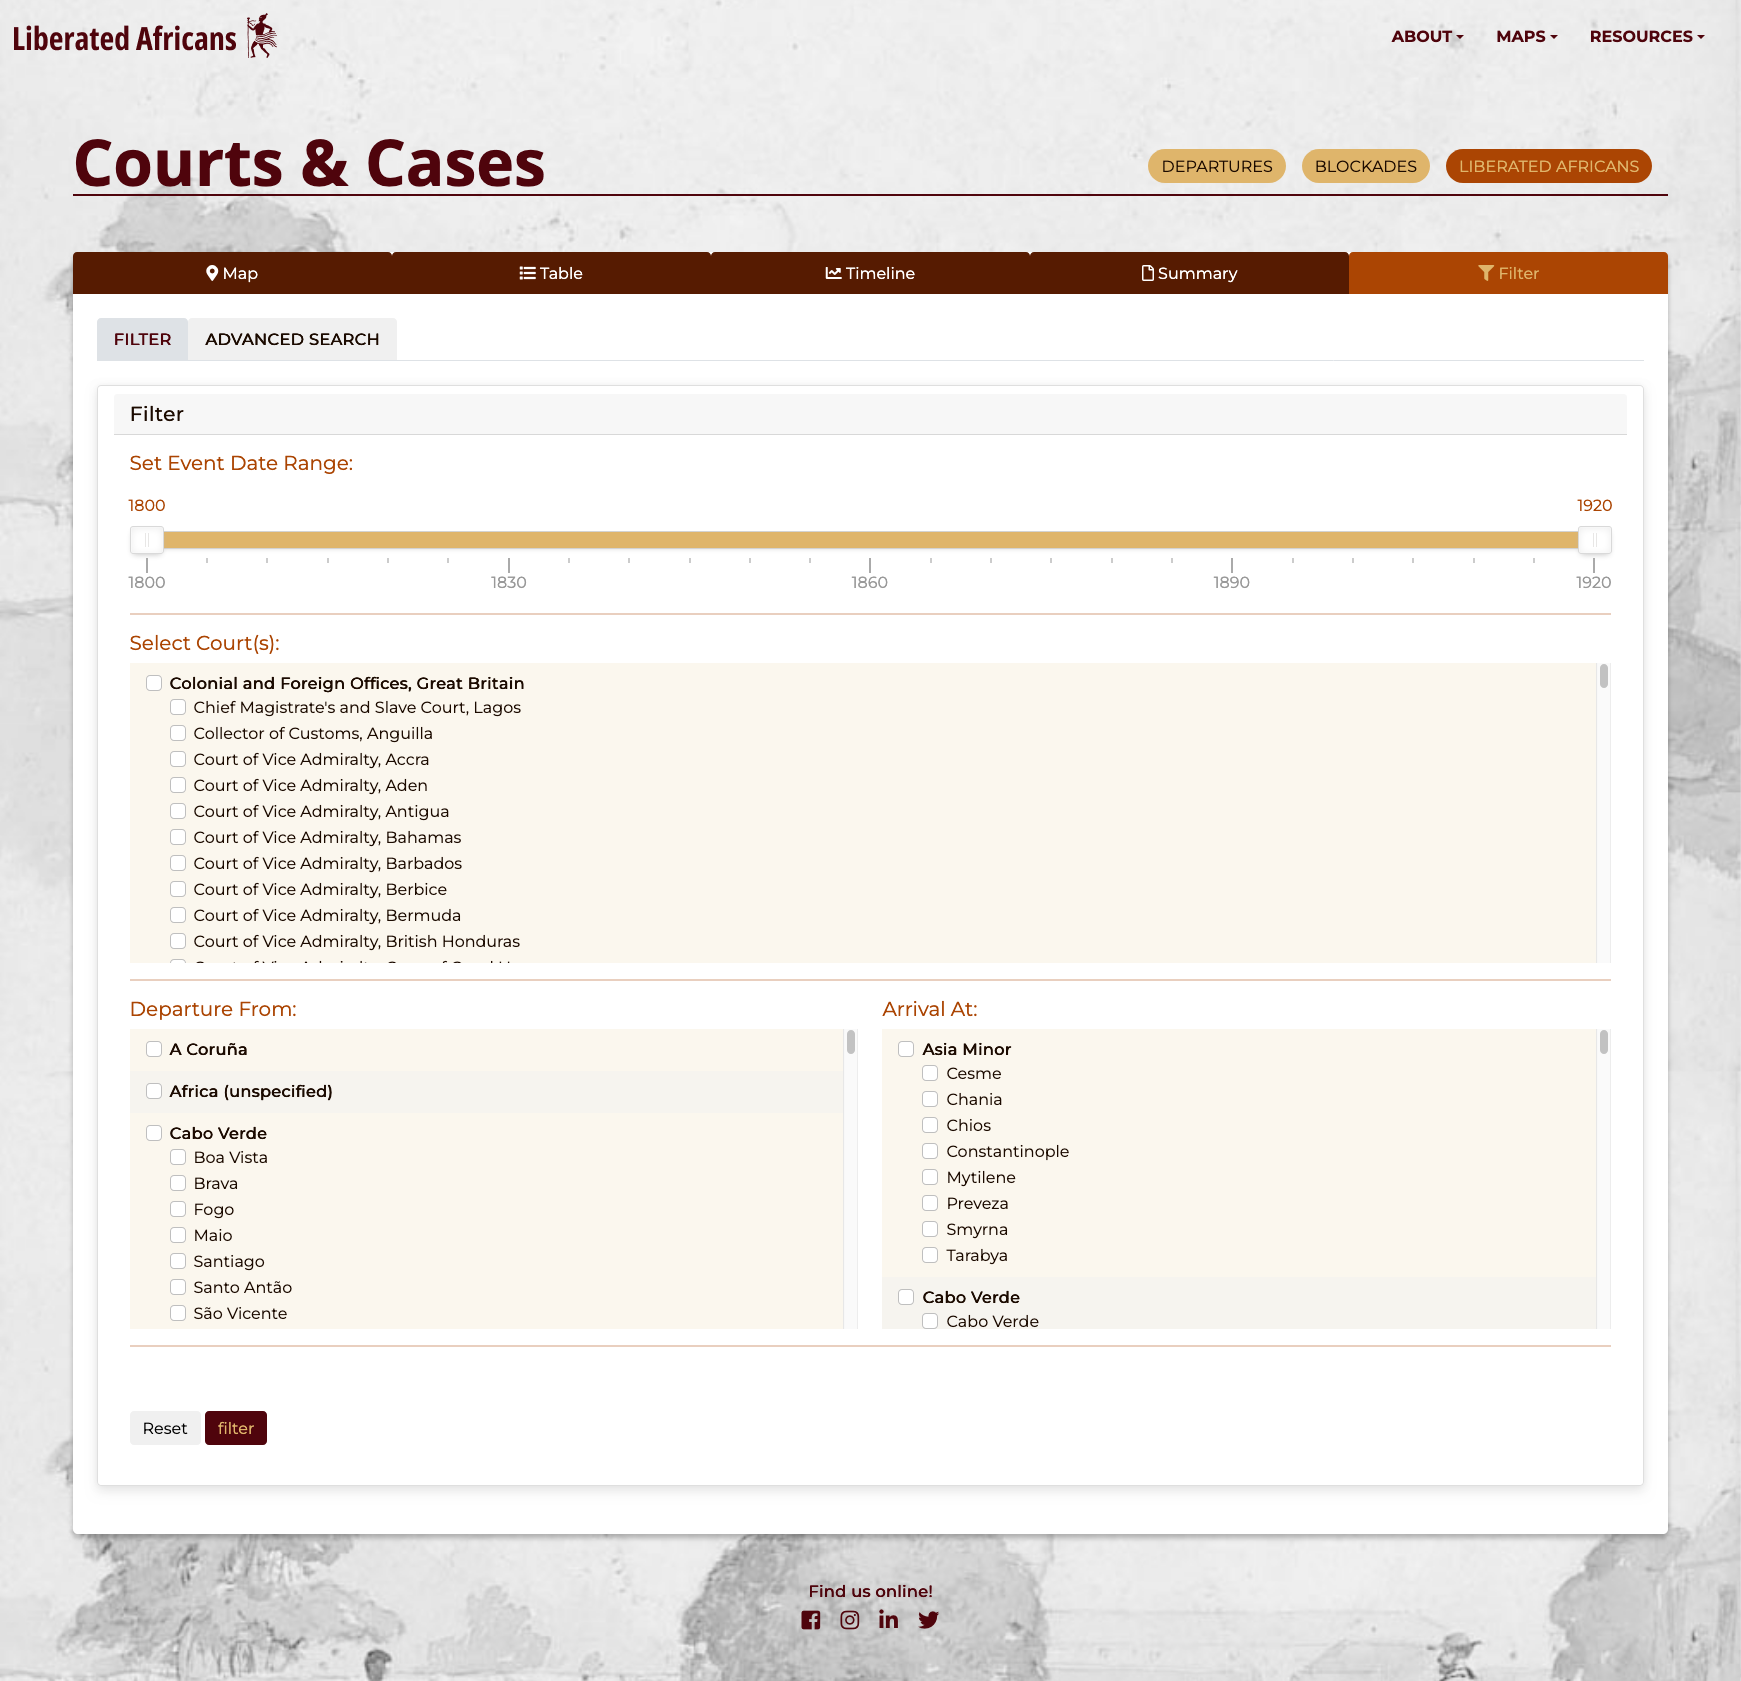
The Advanced Filter allows the user to build their own search query using columns from the database as the search index. The search allows user to add up to 10 rows to their search query.
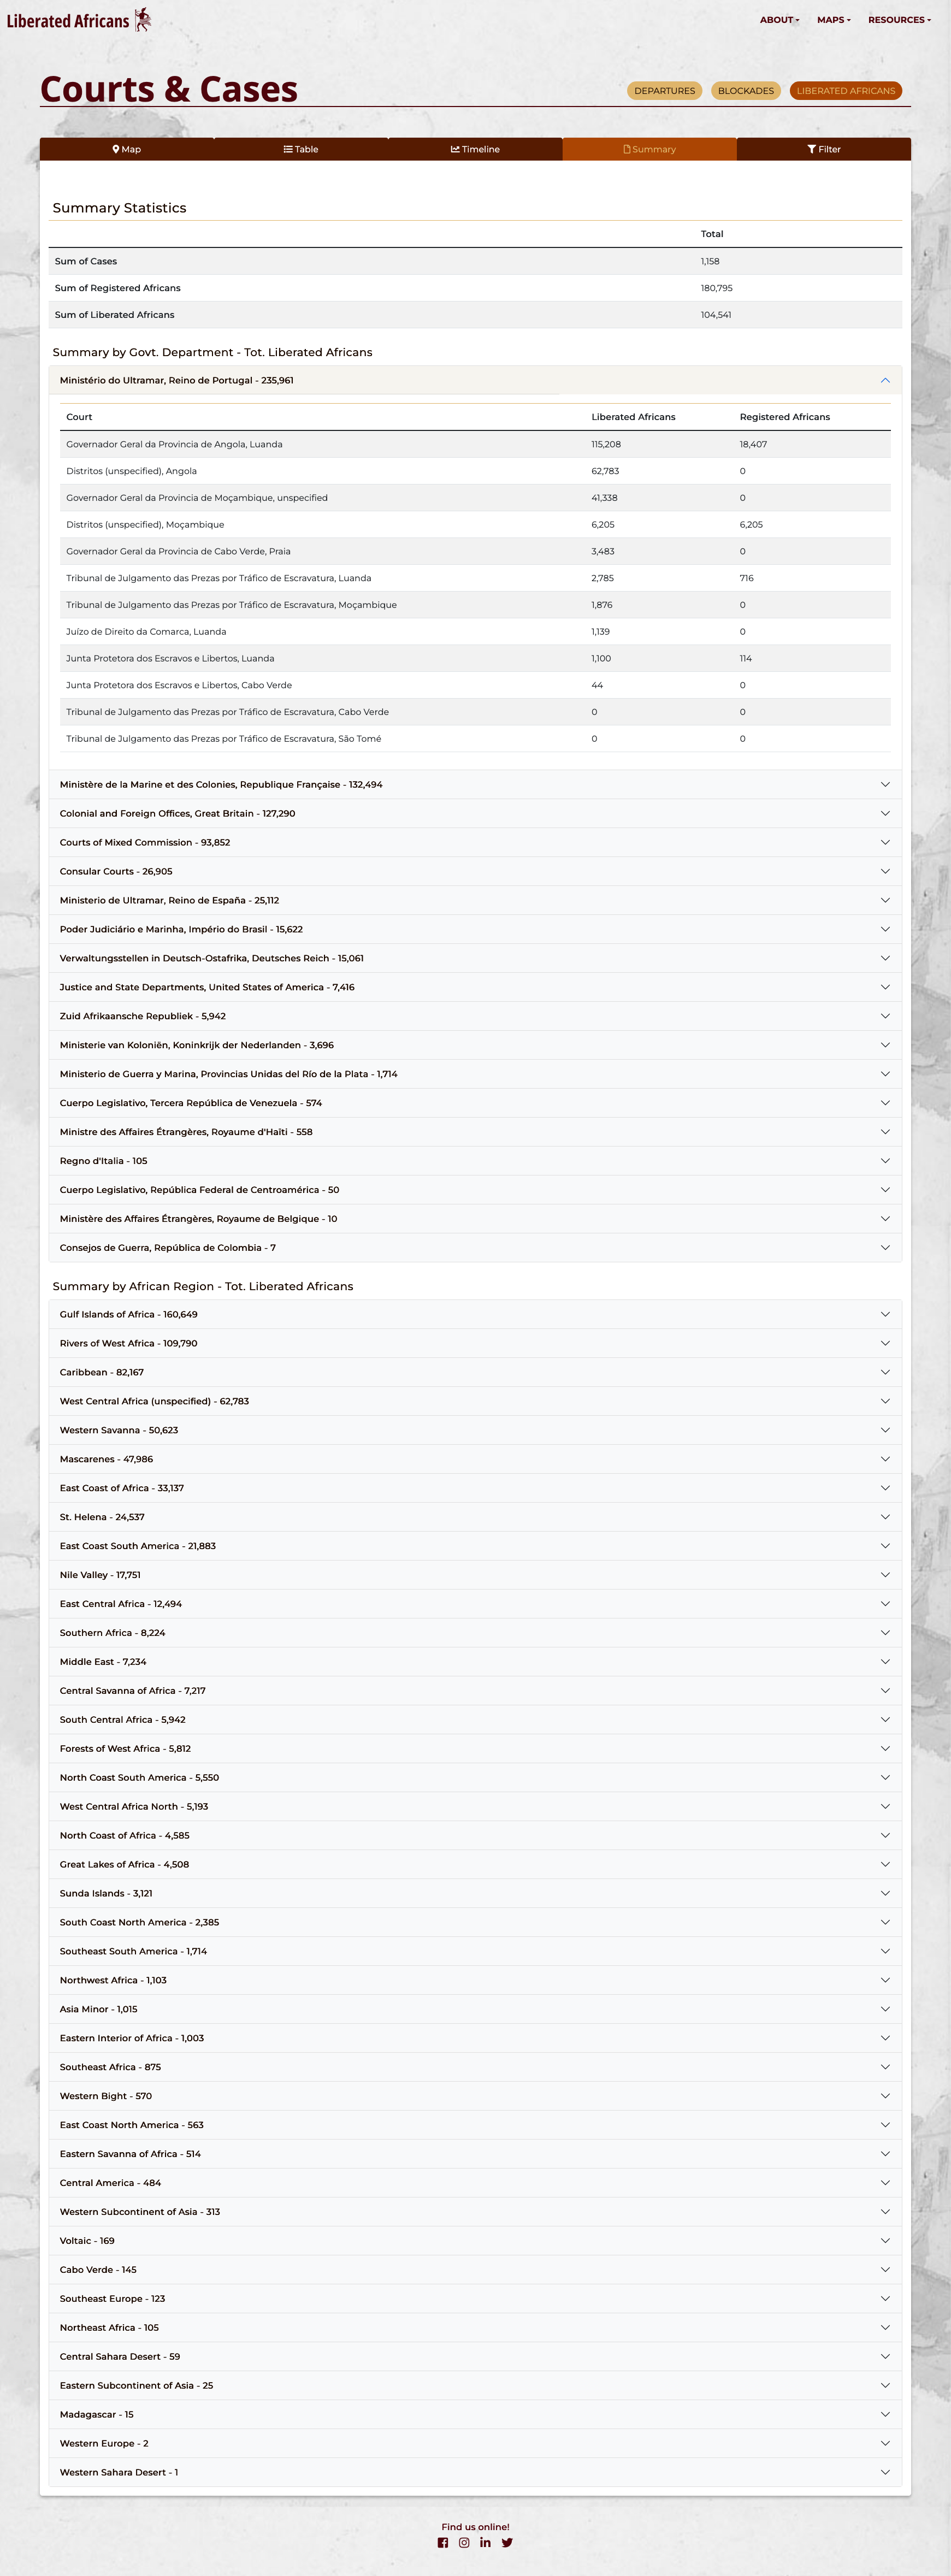
I created a summary of the map data showing the data as statistics grouped by cases, courts, or locations. The summary is presented as clickable accordions.
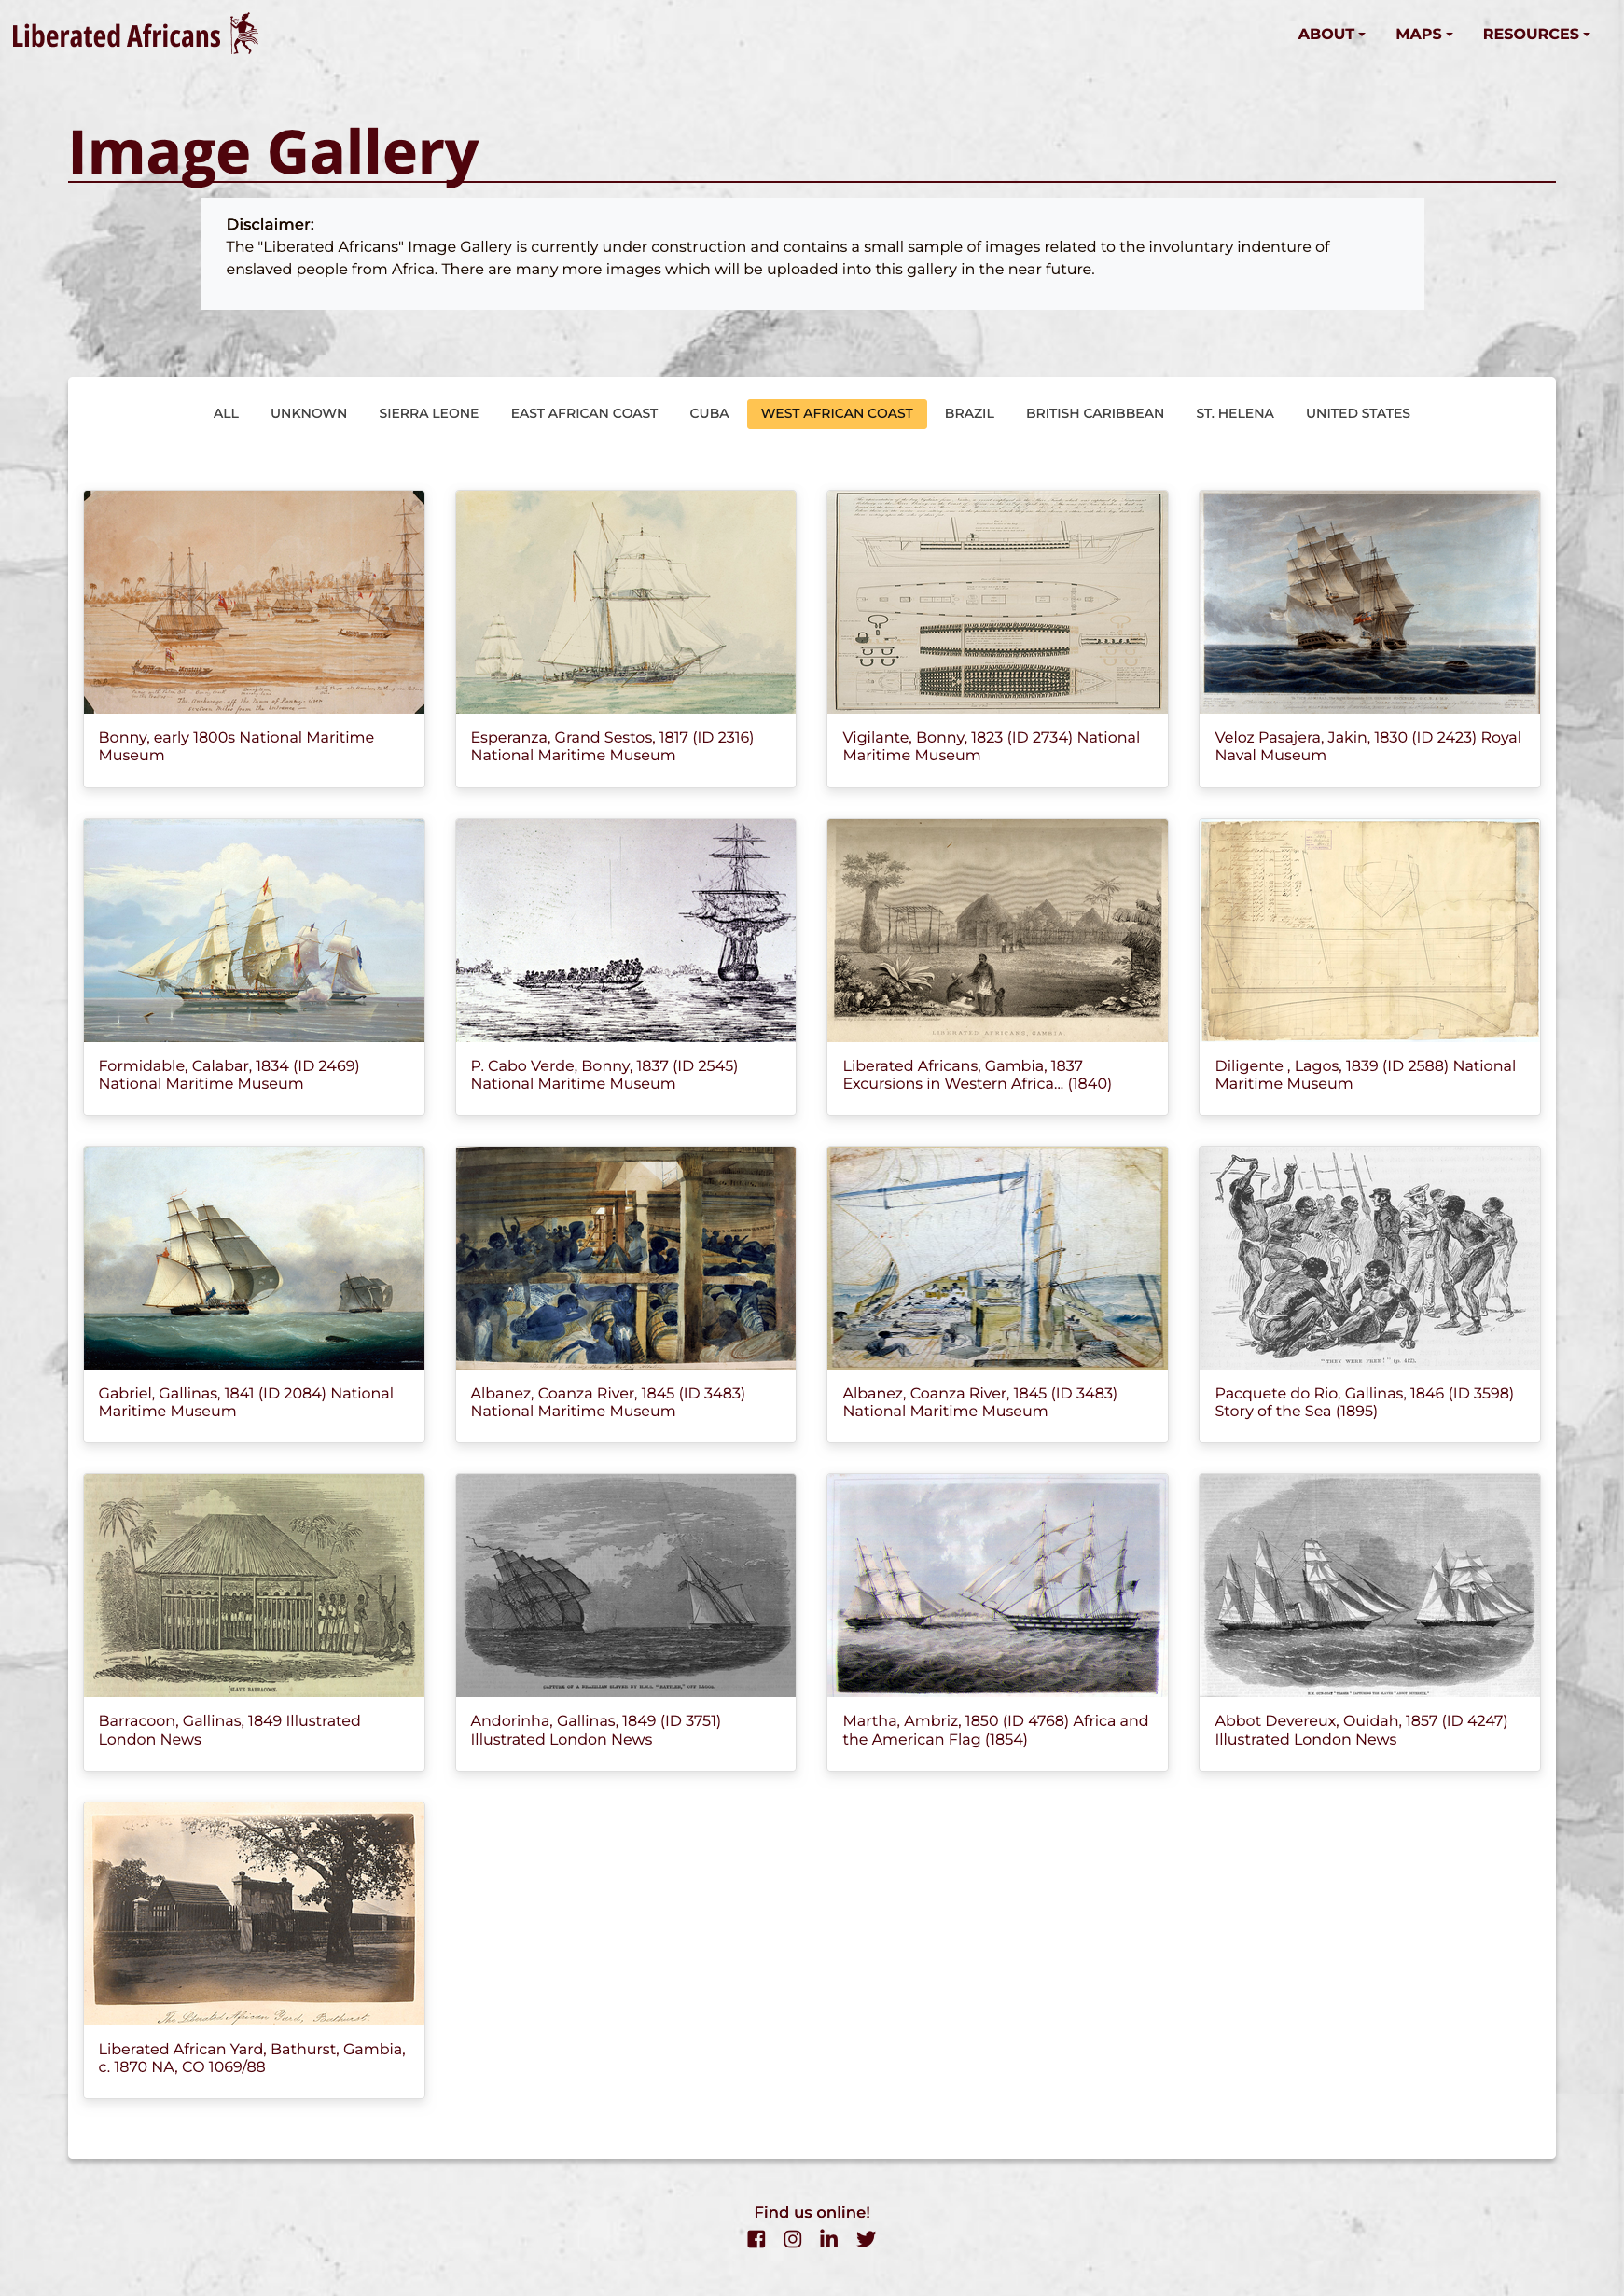
The image gallery features clickable buttons that filter the results grid of images. The updating of content is handled using Walk With Web's data management system, Regenerated Identities.
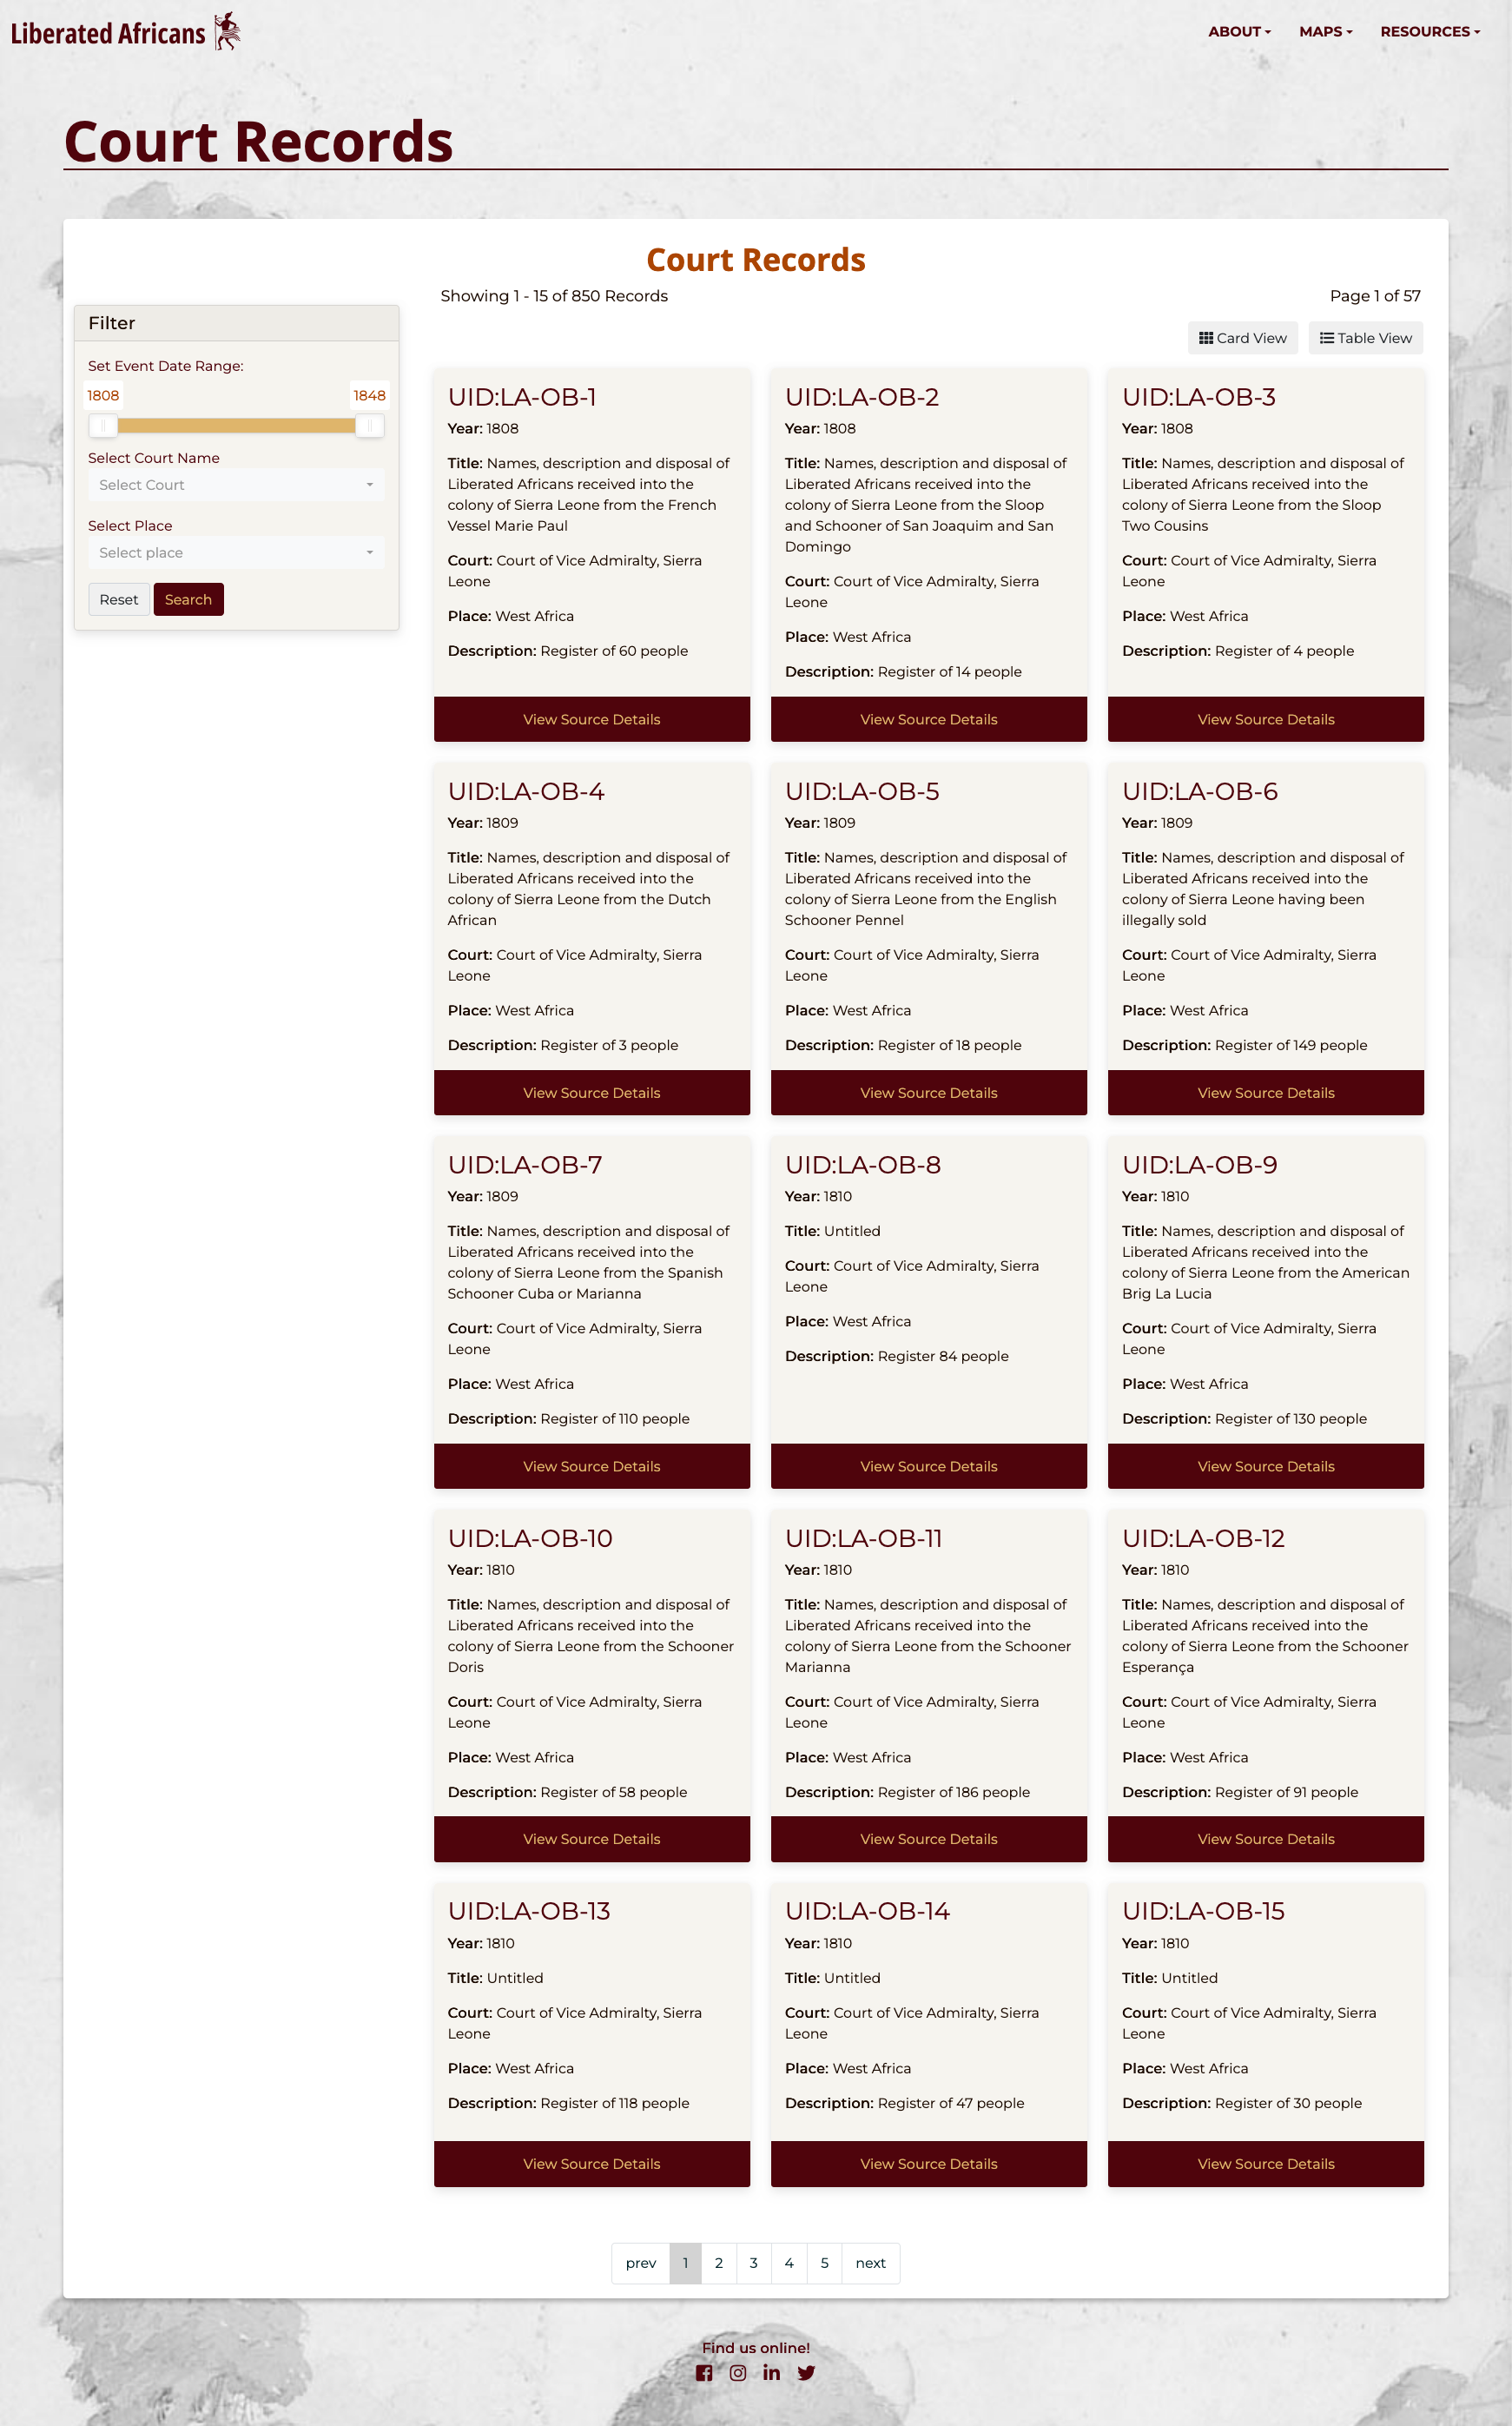
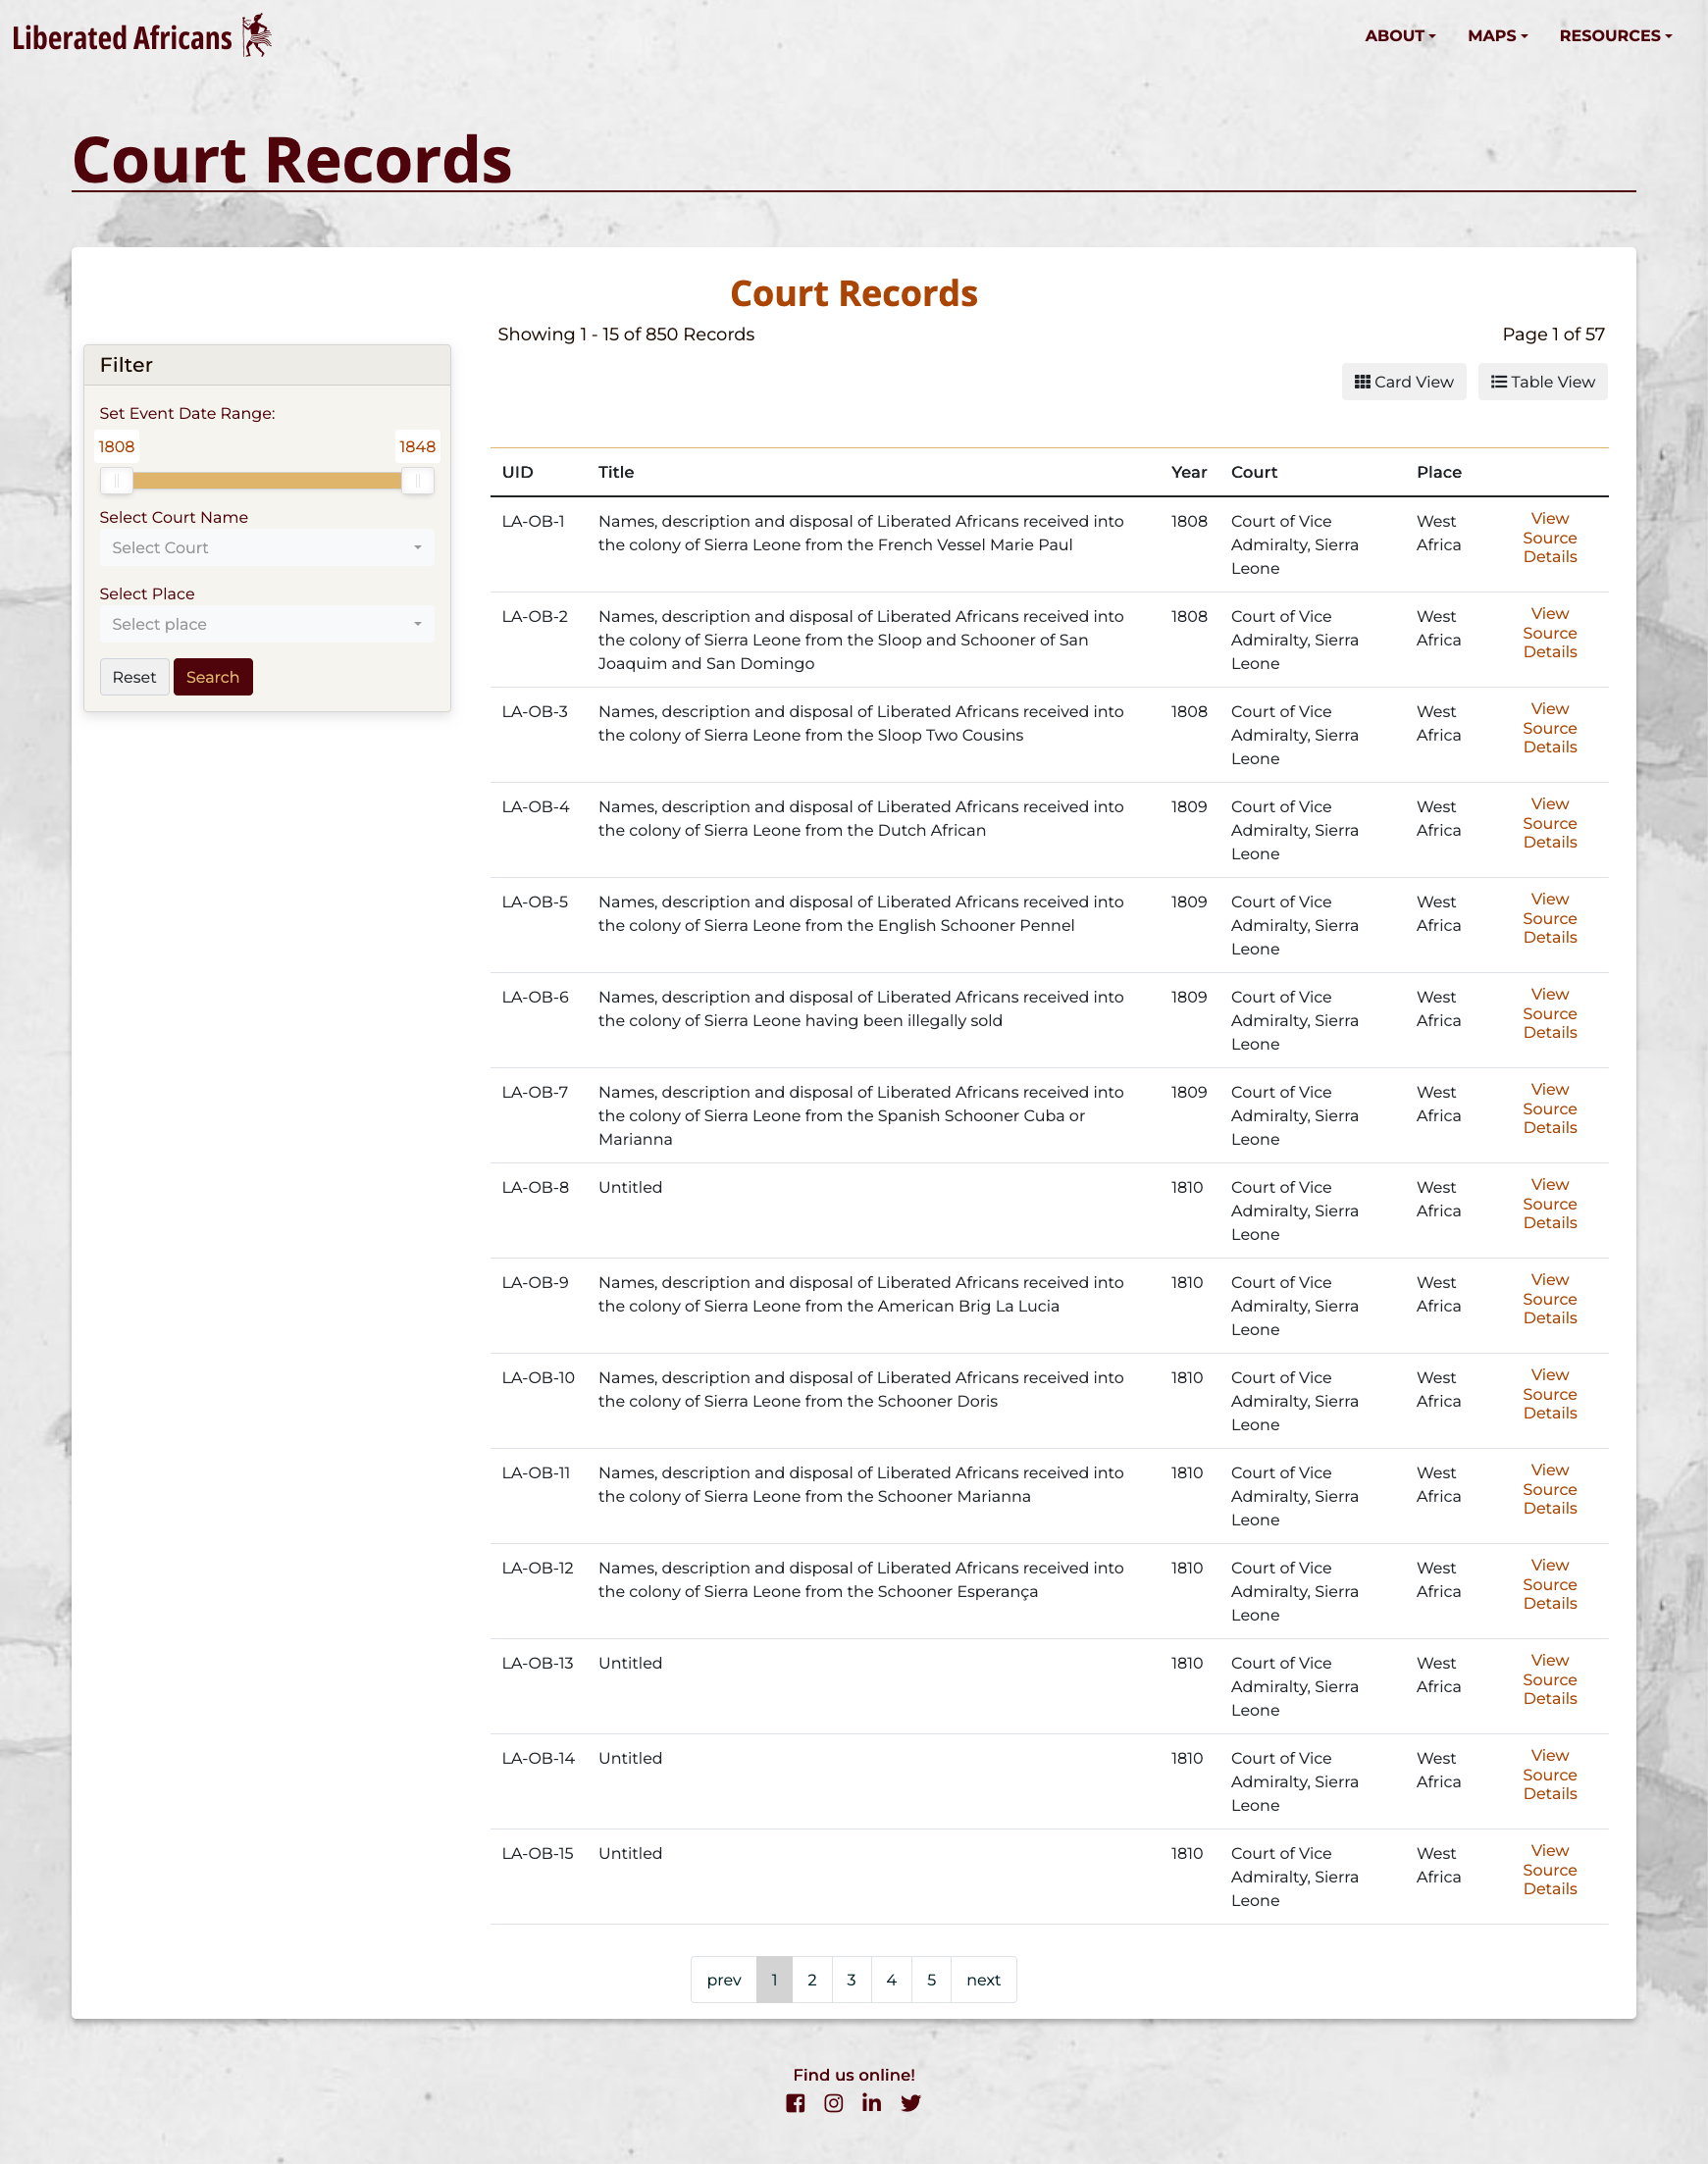
For the Court Records page, data records are presented either as cards or as a table. A simple filter is also provided to allow users to search through the thousands of records.
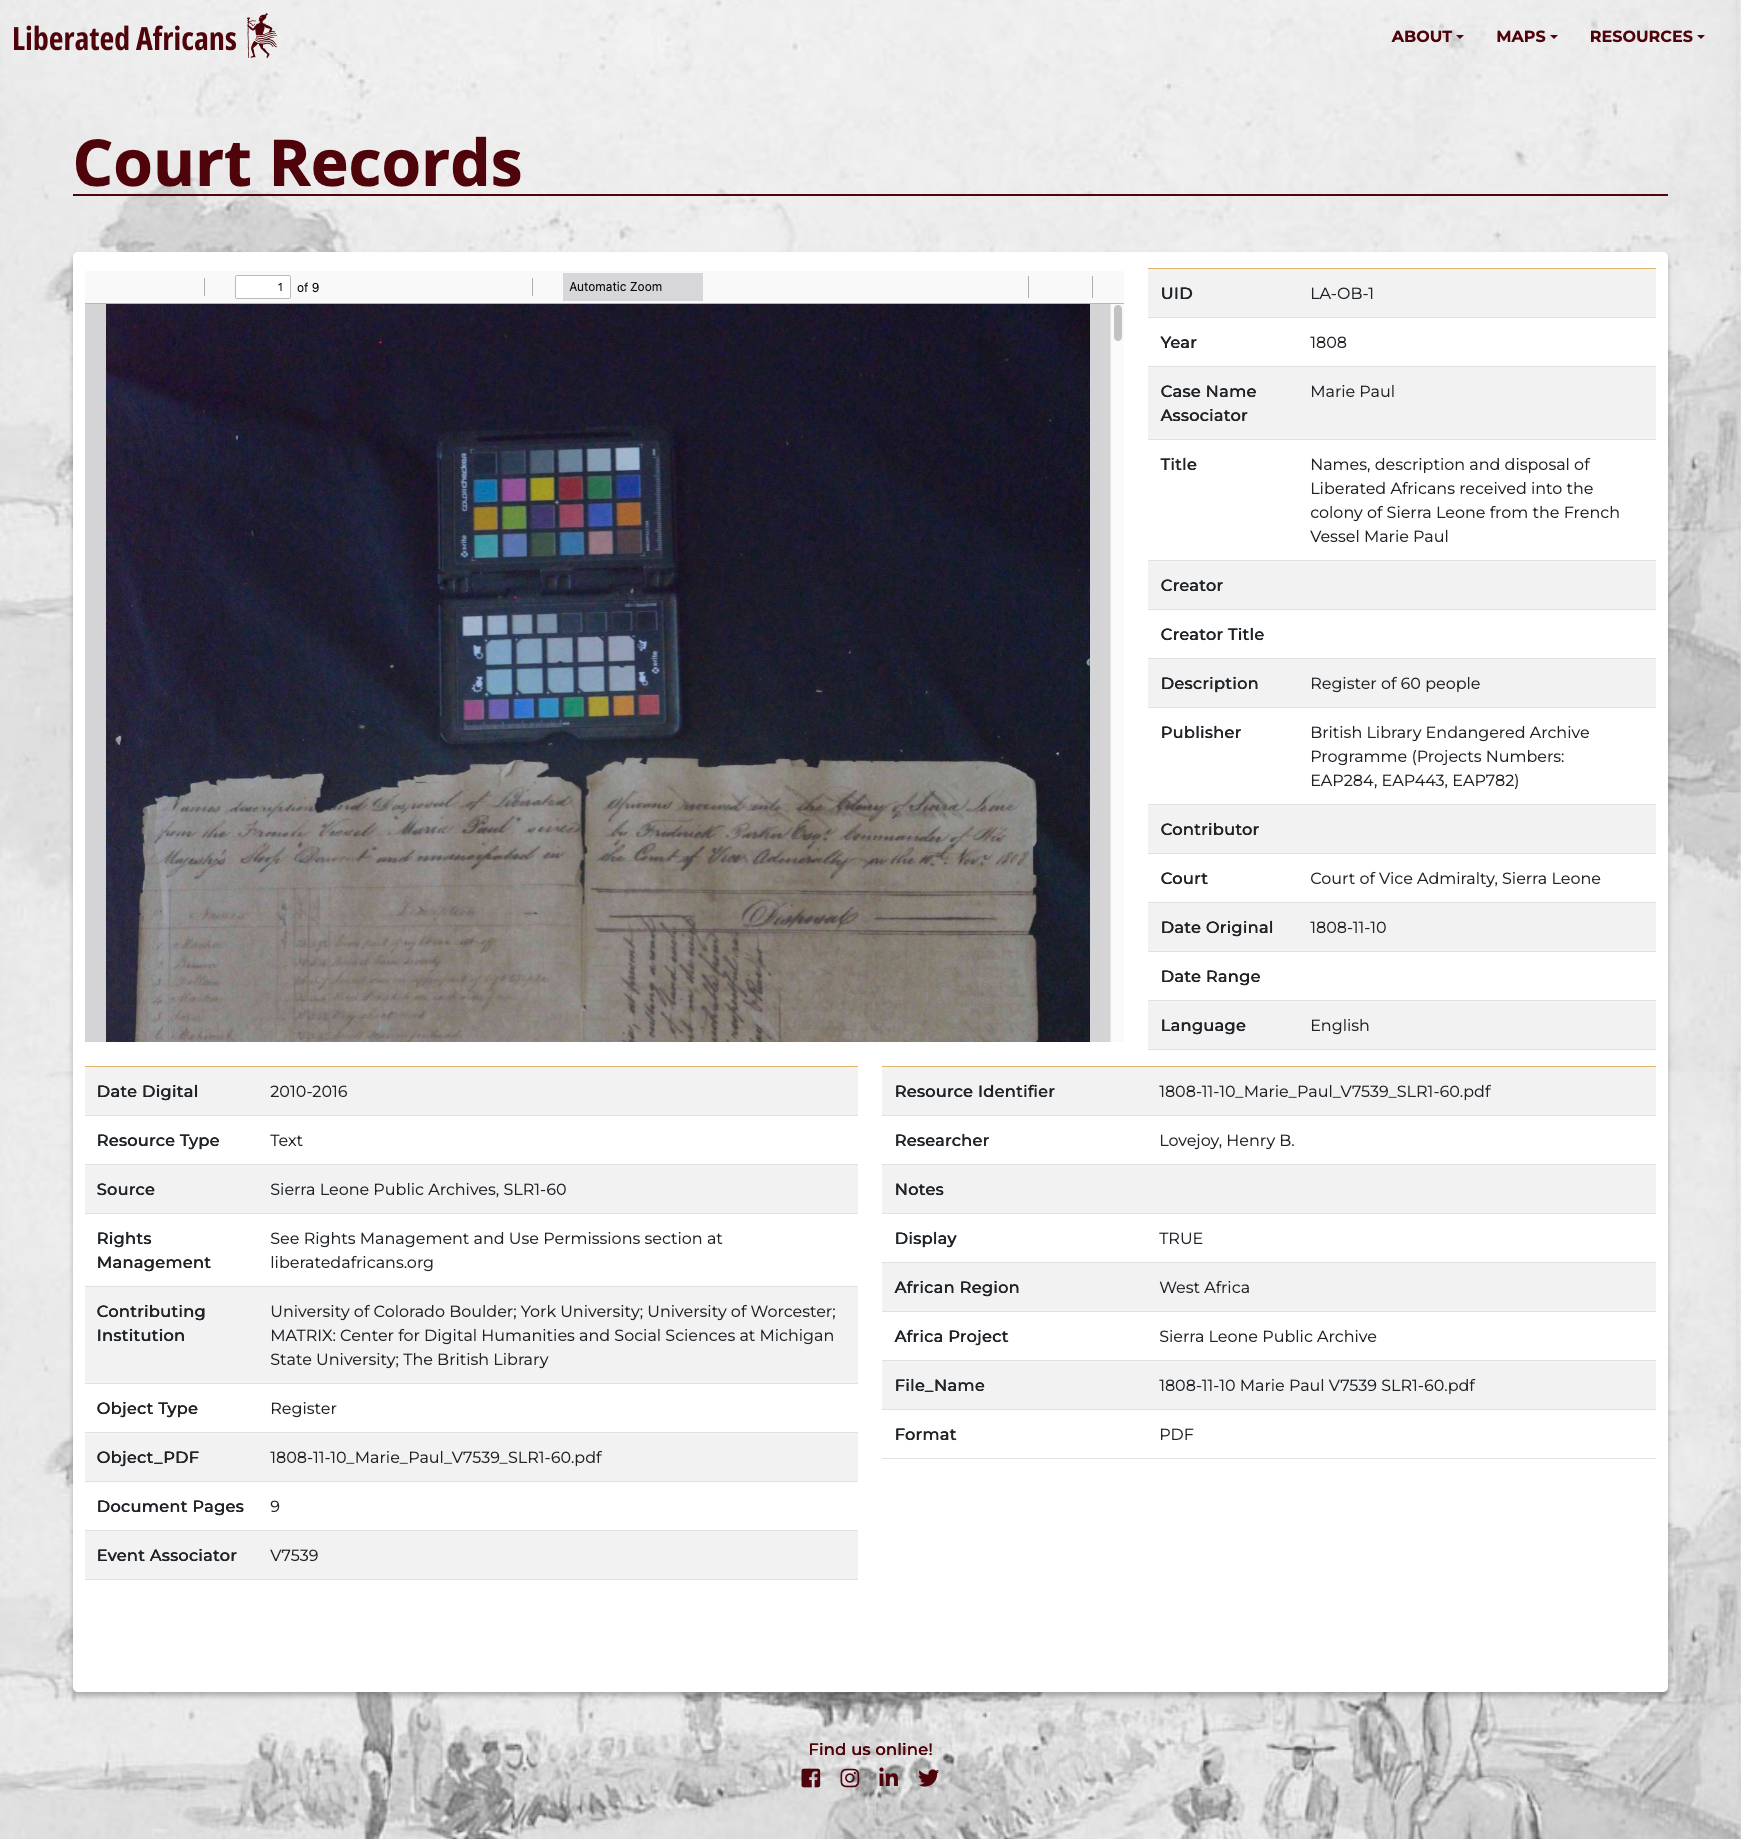
When a card or table row is clicked, the individual court record is shown. The page features an embedded PDF reader which displays the digitized court record. The metadata shown on the page is pulled from the database using PHP.
Walk With Web's digital content management system, Regenerated Identities, allows the project team to upload content via a graphical user interface. This content is updated in real time on the website.